1.Operating instructions
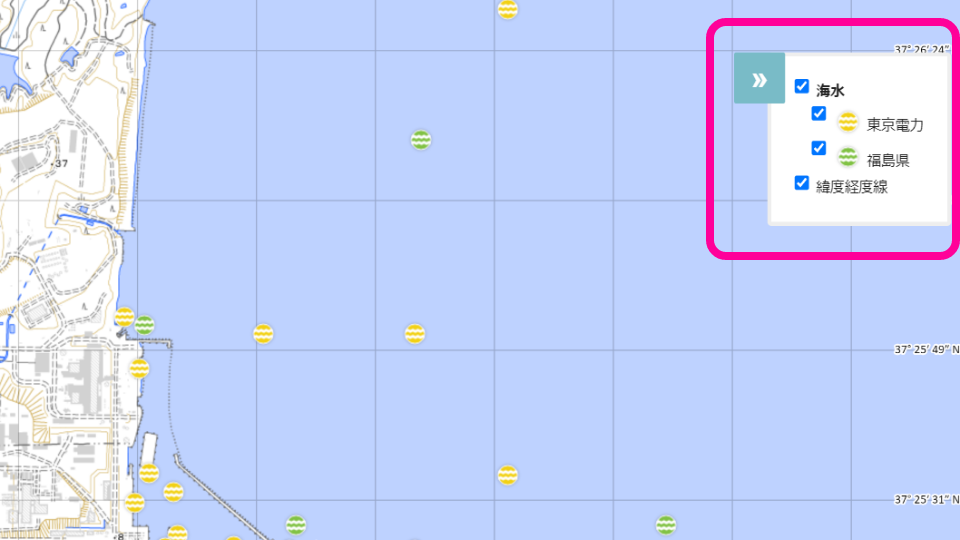
Filtering locations
Click the checkbox in the legend at the upper right of the screen to show or hide the location icons indicating where samples (samples for analysis) were collected, and to filter the locations you want to observe.
You can also show or hide the longitude and latitude lines.
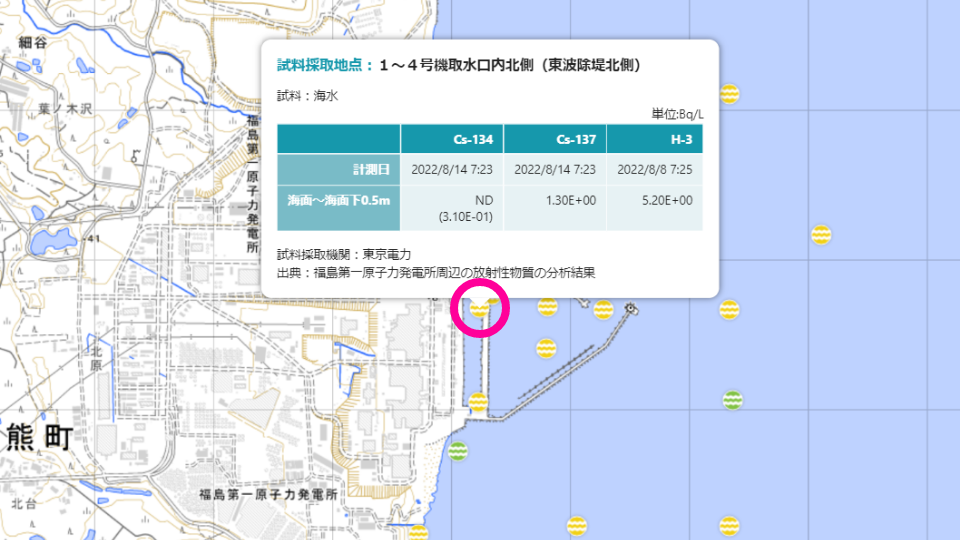
Displaying measurement values
Place the mouse cursor over a location icon in order to display the measurement results in a pop-up window.
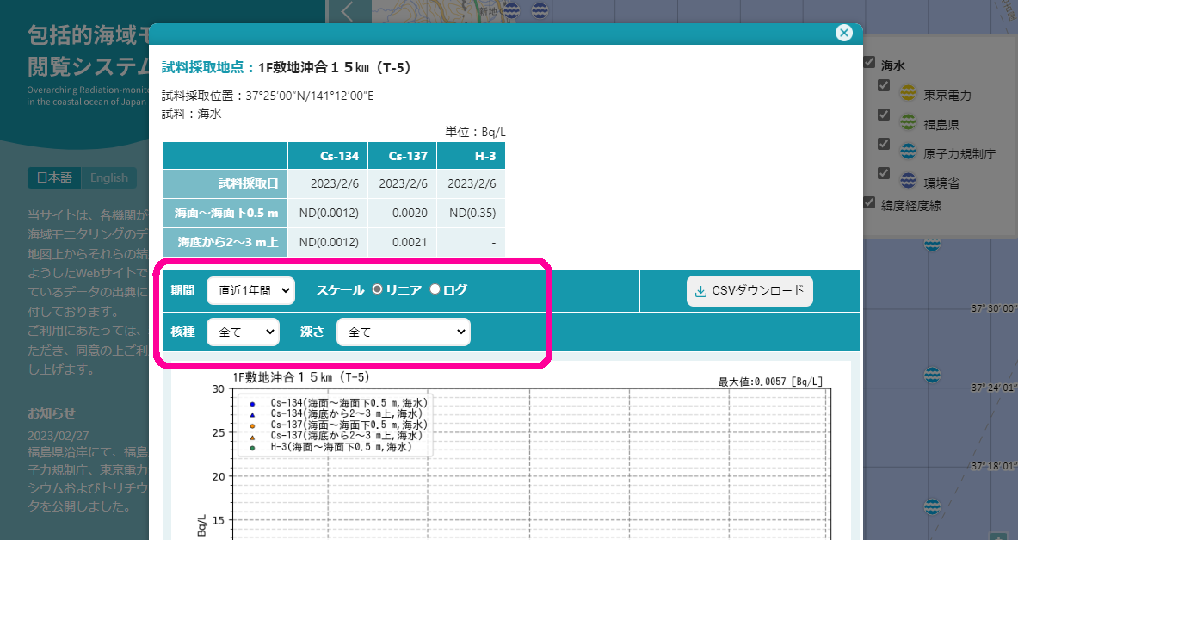
Displaying timeseries graphs
Click the location icon to observe the variations in measurement results as a graph. (*Double-clicking will enlarge the map, so only click once)
Use the pull-down menu to filter the time period, nuclide, and depth.
The scale of the vertical axis of the graph can be selected between linear and log scales using the scale switch button.
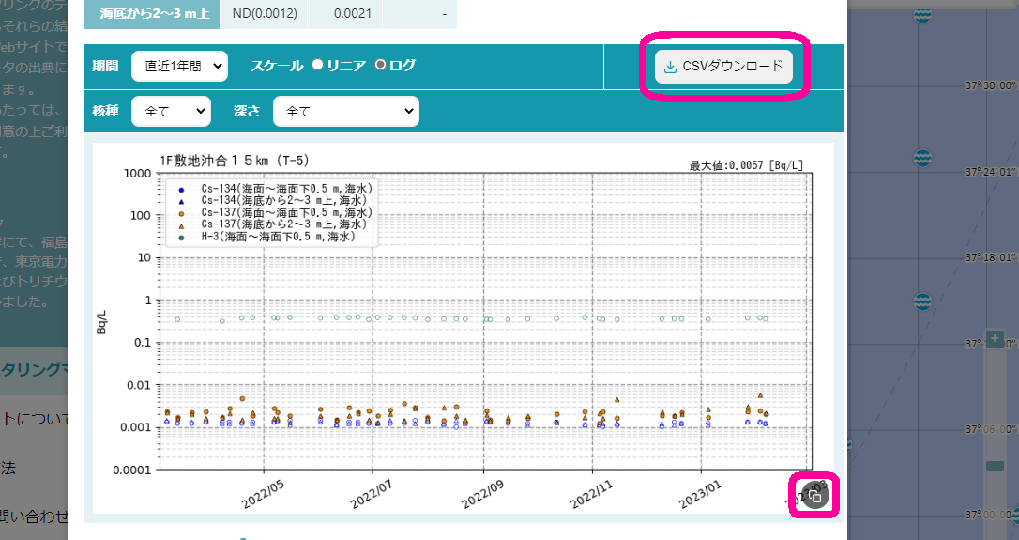
Obtaining timeseries graph data and images
Click the CSV download button in order to download the CSV data for the timeseries graph.
Or click the copy button at the bottom right in order to copy an image of the timeseries graph.
2. Interpreting Figures and Graphs
Sampling position
Assume the locations and latitude/longitude coordinates on the website map are the approximate locations where samples are collected.
Fish monitoring was originally carried out within a certain spatial extent, but due to the display configuration of this system, they are shown as a combination of points and latitude and longitude coordinates. For more information regarding the sampling locations, please refer to the reports and websites of the publisher.
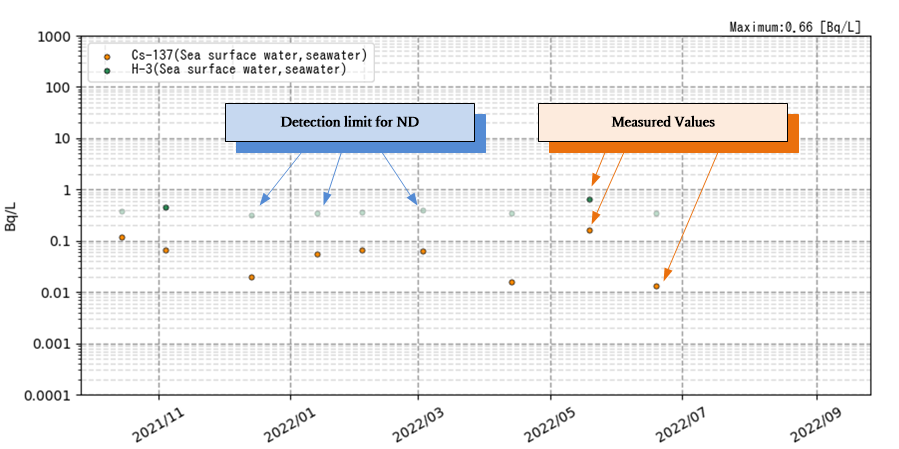
Radioactive concentration values
The notation ND indicates the case where the measurement result is "Not detected," while the number in parenthesis following ND indicates the detection limit (lower limit of detection).
Measured values (radioactive concentration) and detection limits are generally handled as double-digit significant figures.
Depth
"Depth" in the timeseries graph screen indicates the water depth (band) at which the measurement samples were taken.
If the screen does not indicate a specific water depth, the water depth lies within the following range.
Surface Water: Sea surface to a depth of 2 meters
Plot point intensity
On the timeseries graph screen, a dark plot point indicates “measured values” and a light plot point indicates the “detection limit for ND (radioactive concentration falls below the detection limit, so no measured values were obtained)."
In other words, a light plot point means that the radioactive concentration was lower than this value.
Timeseries graphs when detailed analysis is performed
In order to detect even trace amounts of radioactive substances, some sampling locations are regularly analyzed in detail with a lower detection limit than usual.
The following shows an example of a timeseries graph when a detailed analysis has been performed.
*See the explanation of “light plot points” on this page for “Not detected.”
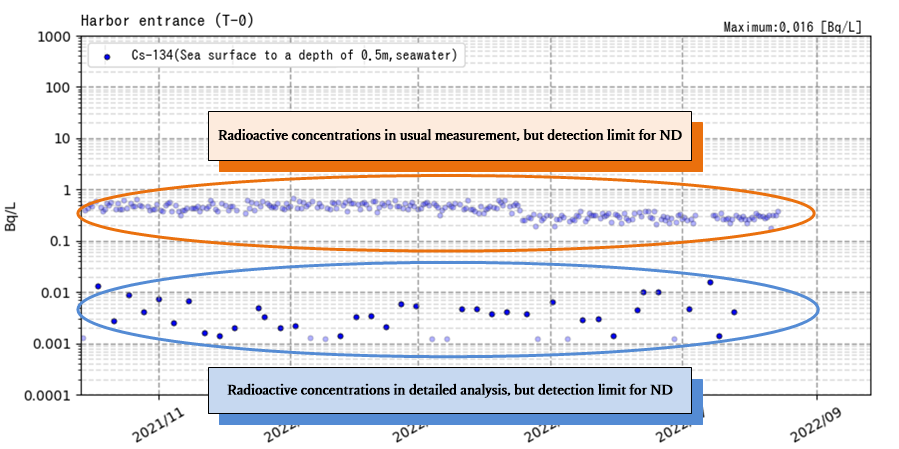
Maximum value
This value indicates the maximum radioactive concentration (excluding the detection limit) during the time period displayed for the timeseries graph.
Description for Organically bound tritium (OBT)
If a non-exchangeable OBT is measured, a total OBT, i.e., sum of an exchangeable OBT and the non-exchangeable OBT, is shown.
3. Note
We sufficiently verify the details of the data. However, if there should be clerical error, for example, difference between the source data and the data posted on this website, please inform us of the error through the e-mail for inquiry of this website